Aging Patterns

Determing aging patterns, and explaining analysis techniques

By Tangotiger

What is a player's peak age? What does that even mean? Is it the single year where the player has his best year, or is it the mid-point of number of years where the player has the best part of his career? As with anything, you have to define the question before you determine an answer. Some analysts even come up with an answer first, and then construct the question. I used to do this. Tim Raines is my favorite ballplayer ever. And I would always argue he was the best, using anything I can find to substantiate that argument. I did the same thing in hockey when comparing Bryan Trottier to Wayne Gretzky. It took me a few years to realize that I was wrong on that one.

Note: Age is calculated as of July 1st, with the remainder rounded off. It doesn't really matter how you calculate age, as long as you calculate it the same way for every player. Every other analyst uses a player's age as of July 1, and drops off the remainder. For example, Tim Raines was born 09/59. In 1999, I have him as 40 years old, while the other analysts mark him as being 39. In actual fact, Raines was 39 years and 9+ months on July 1, 1999. While other analysts truncate his age to 39, I round it to 40. The reason I do this is that the "age 40 class" represents the players who are between 39.5 years and 40.5 years old, and therefore will average 40.0 years old. I don't see any reason to truncate ages, when every other number manipulation we do uses rounding. In any case, no big deal, as long as everyone is consistent within their study.

Defining a peak age

Let me first define a peak age. A player's peak age is that age which shows the most evidence that a player's abilities is at its highest. Now, what do we use as evidence? A baseball player's statistics is the most objective data we have to make this determination. But are the stats themselves misleading in any way?

Lies, damned lies, and statistics

You have to search for the truth in stats. If a player hits 30 HR in 600 AB, is his ability to hit 1 HR every 20 AB? If a player hits 3 HR in 60 AB, is his ability to hit 1 HR every 20 AB? What those 600 AB represents is a sample of a player's abilities. The higher the number, the more indicative the sample is of the "population". If it was humanly possible, researchers would love to have a batter come up to bat in game conditions 100,000 times in a 1 year span. Since this is not possible, you have to take what you're given, and start applying confidence levels.

This is just like an opinion poll. You sample 1,000 people, and declare the results of the poll to be accurate within 3 percentage points, 19 times out of 20. A player's at bats is simply a sample poll of his abilities. The higher the sample, the more confident you are with the results, and the more accurate the results are.

How do the pollsters come up with such a statement? It's all based on distributions and probabilities. Suppose "p" represents the probability that something is true, and "q" is the opposite (or 1 minus p). The number of samples is represented by "n". To calculate one standard deviation, you simply take SQRT(p x q / n). In this poll example, it might be SQRT(.5 x .5 / 1000) = .016. One standard deviation means that 68% of all results will fall within .500 +/- .016 probability. Two standard deviations is +/- .032, and you expect 95% of all samples to fall within this range.

So, is it enough to just look at a player's season and declare something about his abilities? Well, let's look at a player's batting average. Suppose a player hits .300 in 600 at bats. Is his true talent level really a .300 hitter? Well, we can say that 95% of the time, we expect a .300 hitter to have a batting average of about between .260 and .340 in 600 at bats. We can also say that 95% of the time, a .270 hitter will hit between .230 and .310. So, we can't say for sure how good a hitter this player is, with a 600 at bat sample. But how about after 10 years? What if he hits .300 with 6000 AB? Well, now we can say with 95% certainty that this player is a .290 - .310 hitter. The more we can sample the player, the more confident we are.

Looking for aging patterns

A simple technique to look for aging patterns is to simply start adding up the number of hits a player has at every age. Do this for all ballplayers, and you get an aging pattern. The first problem with this is that you have more players who play at the age of 28 than at the age of 38. Just by the sheer volume, it looks like a player will peak at 28 rather than 38.

A second technique is to look at the average at each age. This should take care of the volume problem of the previous technique. Except now, if you look at a pitcher's K/IP rate for all pitchers of age 45, it looks like a pitcher has a pretty good rate at that age. The problem here is that while Nolan Ryan makes up a tiny part of the age 28 class, he makes up a huge part of the age 46 class. Each class is represented by different players. Therefore, the difference is not only attributed to the age, but to the sample chosen.

A third technique is the delta approach. You take a group of hitters who all had at least 300 PA at age 32 and at age 33. You figure out the batting average for this sample group of players for each of the two years. Since your sample is probably quite large, you expect that all the outside conditions that could affect the results will "cancel out". The only difference between these two groups of exactly the same players is the age. Therefore, if this sample of players hit .276 at age 32 and the same group of hitters hit .273 at age 33, we can say, with reasonable certainty, that a hitter's performance will diminish by .003 batting average points between the ages of 32 and 33. You do this matched pair set for all years, and you end up getting a chain of "deltas" (or differences). Then, you can say something like, a .260 hitter at age 23 will hit .265 at 24, .270 at 25, .273 at 26, .274 at 27, .274 at 28, .273 at 29, .271 at 30, etc, etc.

I've used this last approach many times. But are there limitations to such an approach? Unfortunately, yes. The problem is that you are selecting players with 300 PA in year x, and in year x+1. Just by the virtue of them having 300 PA in the year in question (year x+1) automatically means that they probably had a decent year. Therefore, it is not a random sample. It's rigged. This is called selective sampling. If we decided to just take all the guys with 300 PA in year x, and see how they did in year x+1, then what do you do with the guys with 32 PA in year x+1? We are not very condident in what the performance of 32 PA represents. What you can try to do is weight the performance by the lower of the 2 PAs. This way, a guy with only 32 PAs won't affect the results much. But again, this reintroduces the previous problem. By virtue of having only 32 PAs probably means that this player did not have a good year to begin with. (I realize that there are many reasons that a player can go from 300 PA to 32 PA. Injuries being one, poor initial performance being another, etc. If you look, you will see that the overall performance of players who go from 300 PA in one year to 100 PA in the next year will show a drop in production. Whether this means a drop in ABILITY is not implied.) We've got problems.

Therefore, what we have to do is measure the degree of this problem. A limitation exists, but how bad is this limitation? And is this limitation different for hitters and pitchers?

Looking at different samples

If you look at all players who played exactly two seasons at age 24 and 25, what do you think you will find? Well, first of all, if he only played two seasons, then he probably wasn't very good. Or more precisely, he probably didn't put up good numbers, because all he had to show was a sample of his true ability. Secondly, if he was good enough to get a look at a second season, but not good enough to get a look at a third season, then chances are that his second season was worse than his first. Therefore, when you select your group of players, you have to be aware of this.

The study

I will define a regular player as someone who has at least 300 PA (AB+SF+BB+HBP) in a season. I will look only for players who had an uninterrupted string of regular seasons (meaning that Ted Williams is out of this study, but guys who were part-timers at the start or end of their careers like Tim Raines are in). I also only look at players whose first regular season was no earlier than 1919 and whose last regular season was no later than 1998. From this group of players, I will break them down by
- debut year as a regular
- number of years as a regular

I will also use a hitting measure I "invented" called Linear Weights Ratio (LWR), which you can consider as a total hitting measure. (The formula for this study is: 1 x 1B + 1.6 x 2B + 2.2 x 3B + 3.0 x HR + 0.7 x BB + 0.7 x HBP all divided by AB - H + SF)

For each player, I express each of his seasonal LWR as a percentage of his career-high LWR. Therefore, every player will have a 100% level at some point in their career. I'm trying to determine a player's "% of peak" for every year.

Concentrating only on those players that debut at age 25 and who played for 9 years, here's what this gives us:


Debut age 25, 9 years
Age	Peak%
25	 0.844 
26	 0.844 
27	 0.836 
28	 0.875 
29	 0.842 
30	 0.804 
31	 0.871 
32	 0.824 
33	 0.794 

The total number in this sample is 15 players

So, what does this tell us? Well, the players hit their peak, on average, at age 28, followed closely by age 31. Their 3 worst years were at age 30, 32, 33.

Now, what do we learn here? First of all, their worst year was their last year. This is practically a given in any sample that we will see. Chances are a player's skills did diminish, but probably not as much as the stats said they did. A team though will ignore that, and simply not give that player a chance.

Here's the table showing all players who debut at age 25, broken down by years of experience. The last line in each table is the number of players in the sample.


Peak%, players debut age of 25, by years of experience
Age	2	3	4	5	6	7	8	9	10	11	12	13	14	15
25	 0.950 	 0.886 	 0.900 	 0.887 	 0.907 	 0.822 	 0.833 	 0.844 	 0.811 	 0.780 	 0.848 	 0.842 	 0.753 	 0.806 
26	 0.935 	 0.968 	 0.896 	 0.874 	 0.881 	 0.882 	 0.872 	 0.844 	 0.821 	 0.849 	 0.828 	 0.969 	 0.880 	 0.765 
27	 -----	 0.865 	 0.939 	 0.840 	 0.849 	 0.872 	 0.882 	 0.836 	 0.894 	 0.919 	 0.807 	 0.856 	 0.926 	 0.775 
28	 -----	 -----	 0.851 	 0.811 	 0.897 	 0.879 	 0.866 	 0.875 	 0.893 	 0.876 	 0.831 	 0.862 	 0.897 	 0.784 
29	 -----	 -----	 -----	 0.841 	 0.868 	 0.810 	 0.905 	 0.842 	 0.865 	 0.915 	 0.799 	 0.895 	 0.805 	 0.823 
30	 -----	 -----	 -----	 -----	 0.785 	 0.826 	 0.875 	 0.804 	 0.840 	 0.895 	 0.756 	 0.845 	 0.853 	 0.915 
31	 -----	 -----	 -----	 -----	 -----	 0.774 	 0.851 	 0.871 	 0.818 	 0.973 	 0.808 	 0.928 	 0.992 	 0.763 
32	 -----	 -----	 -----	 -----	 -----	 -----	 0.779 	 0.824 	 0.842 	 0.879 	 0.818 	 0.888 	 0.840 	 0.909 
33	 -----	 -----	 -----	 -----	 -----	 -----	 -----	 0.794 	 0.771 	 0.866 	 0.775 	 0.873 	 0.909 	 0.895 
34	 -----	 -----	 -----	 -----	 -----	 -----	 -----	 -----	 0.704 	 0.907 	 0.733 	 0.848 	 0.805 	 0.827 
35	 -----	 -----	 -----	 -----	 -----	 -----	 -----	 -----	 -----	 0.826 	 0.732 	 0.804 	 0.784 	 0.782 
36	 -----	 -----	 -----	 -----	 -----	 -----	 -----	 -----	 -----	 -----	 0.640 	 0.818 	 0.820 	 0.854 
37	 -----	 -----	 -----	 -----	 -----	 -----	 -----	 -----	 -----	 -----	 -----	 0.854 	 0.748 	 0.901 
38	 -----	 -----	 -----	 -----	 -----	 -----	 -----	 -----	 -----	 -----	 -----	 -----	 0.800 	 0.804 
39	 -----	 -----	 -----	 -----	 -----	 -----	 -----	 -----	 -----	 -----	 -----	 -----	 -----	 0.731 

Count	 30 	 17 	 8 	 10 	 12 	 14 	 14 	 15 	 9 	 2 	 7 	 5 	 3 	 3 

Now, what do we make of all this? Let's take them one at a time. This first group is guys who debut at age 25, and played for 2 years as a regular. As you'd expect, they had their worst year, on average, in the last (second) year. So, we really don't learn much from this group of players. For players who happened to have played 3 years, they hit their peak in their middle year (age 26), and performed worst in their last year (age 27), which tradition has shown us to be a player's peak age. Strange isn't it? Well, not so strange, when you consider that the player's worst year was his last year. For players with 4 years experience, their best year was age 27, and their worst was again their last year (age 28). For players with 5 years experience, their best year was their FIRST year (age 25), and their worst was their second-to-last (age 28). A slight surprise, but at this point, we are starting to lose our sample size.

As you go through each list, you will see that the longer a player plays, the more opportunity he has to peak later. Think of Edgar Martinez. If your career is over at age 26, how can you peak at age 27? As well, in virtually every class, not only is their last year their worst year, but in a great majority of those cases, the drop-off rate between their last 2 years is far greater than any other 2 years. Again, this is part of selective sampling. Since a manger gets to choose if a player continues to get 300 PAs, a player will not have a chance to show that the previous year, while bad, wasn't as bad as his abilities say it should have been.

The delta approach, with a twist

I will run a delta approach to the original sample of players (Williams out, Raines in), but I will ignore the player's last year. Since it is his last year, is it virtually impossible that a player will have had his peak season at this point? In fact, 14% of the players had their peak year in the LAST year. Remember the lies and stats story? Well, let me give you some more details. A great majority of the players who peaked in the last year also only played 2 or 3 seasons. If we look at those guys with at least 7 years experience, 11 (out of 388, or less than 3%) players peaked in their last year, with Kevin Mitchell being the most prominent of those players.

This is probably a good point to mention that the player stats were unadjusted. There are two important adjustments that should be made: park, and year. A player who manages to switch from Dodger Stadium to Coors Stadium will have his hitting stats go up overall. Therefore, any player who happens to switch parks will not have an accurate reflection of his peak year, if we don't account for this. However, we are not looking at individual players, but players as a group. And you would expect that for every player that goes from a hitting park to a pitching park that you would have a corresponding player go the other way. To be more accurate, you should account for this. But you will not add much accuracy if you start to adjust for park.

The year-to-year changes in stats is more problematic. While we are "saved" in the park adjustments with players being traded for each other, everyone gains if looking at stats from 1968 to 1969. You will find that a disproportionate number of peak years will occur in high-scoring years. This should be accounted for. For this article, let's let that one slide. In a followup article I will do on aging, I will not only consider the park and year, but I will bring in a much larger sample of players.

The results

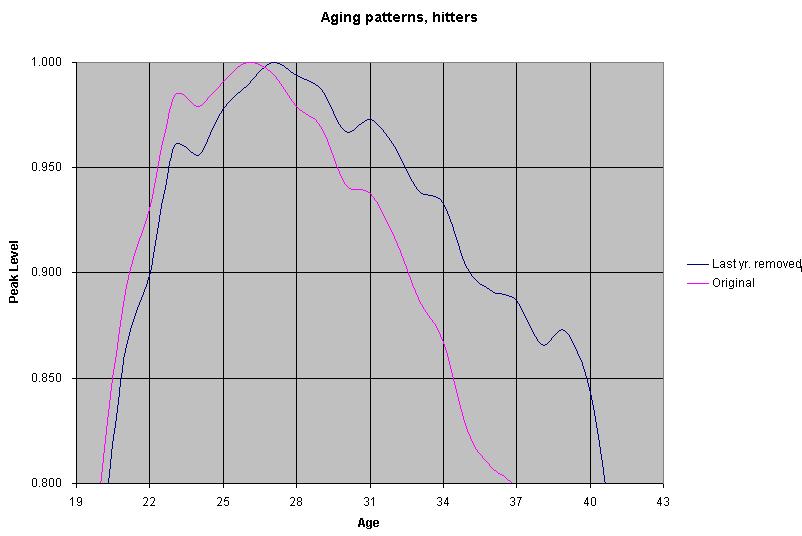
At the end of this article, you will see a table showing the aging patterns for the sample of players described. A player's peak age is around age 27, with the age group 23 - 32 being a hitter's 10 best years.

However, with the player's last year not removed, things change slightly. A player's peak age is 26, while his peak career is from age 22 to 30. This is a false representation of a player's aging pattern.

I would not be surprised if there are other considerations that I have not looked at that would push the peak age all the way to 28 or even 29. Or that if I approached this problem from a different angle, I'd get different results. The best way to do this study is to have every MLB player play from age 18 to 48, and give them each 100,000 PA per year. Then we can find the true aging patterns.

Giving each player 500 PAs, and selectively choosing which years they get to perform in to show their abilities is a huge stumbling block. While the effect of selective sampling for a hitter's aging patterns is real, but not very pronounced, the effect on a pitcher's aging patterns is huge. I will look at pitchers aging patterns in a future article.


Aging patterns, hitters
Age	Count	 Level 	Count	 Level 
19	3	 0.652 	3	 0.682 
20	9	 0.764 	10	 0.799 
21	43	 0.863 	45	 0.891 
22	106	 0.899 	110	 0.930 
23	196	 0.960 	212	 0.984 
24	292	 0.956 	328	 0.979 
25	386	 0.978 	441	 0.991 
26	450	 0.989 	516	 1.000 
27	487	 1.000 	573	 0.995 
28	466	 0.994 	556	 0.979 
29	423	 0.987 	515	 0.969 
30	358	 0.967 	452	 0.942 
31	302	 0.973 	376	 0.938 
32	233	 0.960 	313	 0.917 
33	168	 0.939 	239	 0.888 
34	113	 0.933 	169	 0.867 
35	74	 0.902 	116	 0.825 
36	47	 0.891 	75	 0.807 
37	28	 0.887 	47	 0.796 
38	15	 0.866 	28	 0.745 
39	6	 0.872 	15	 0.726 
40	5	 0.843 	6	 0.716 
41	2	 0.764 	5	 0.637 
42	2	 0.641 	2	 0.546 
43	0	 0.769 	2	 0.655 

The first level column is with the hitter's last year removed, 
and the second level column is with the hitter's last year in tact.

The image below matches the table above.